
Since 2017, Coal Down 39% and Solar Up More Than Fivefold
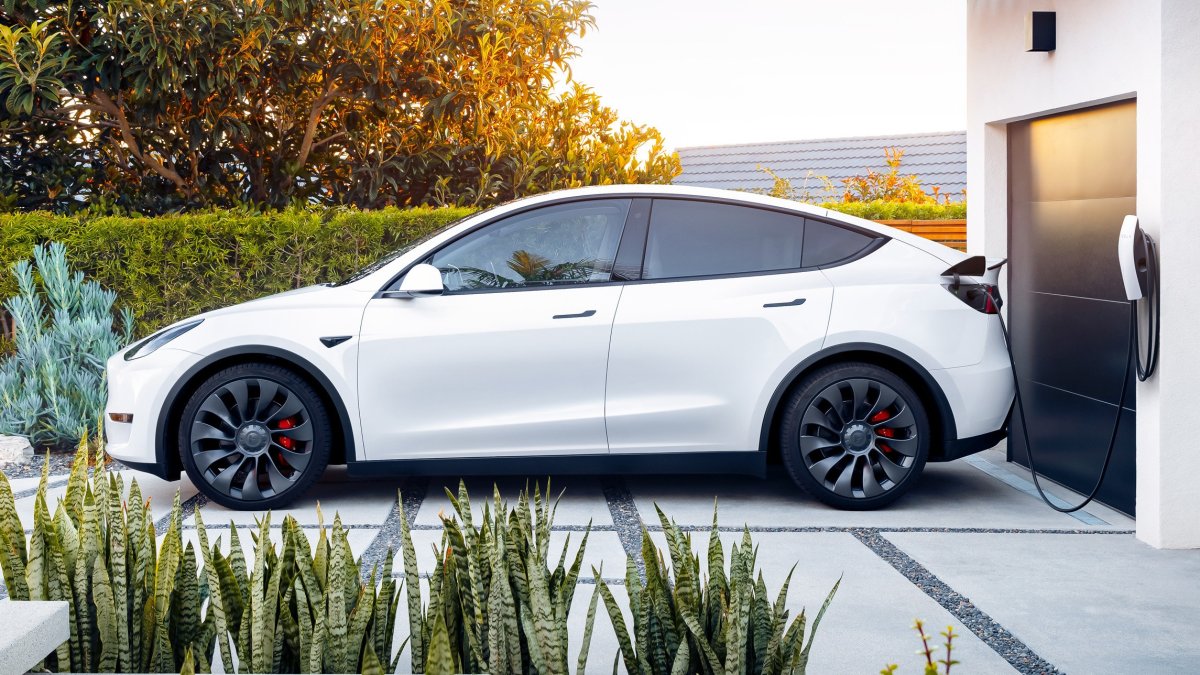
Gasoline vehicles consume the same fuel on day one and day 5,000. Electric vehicles are different: because they run on grid electricity, their effective emissions fall as the grid adds more low‑carbon generation, even if nothing about the car changes.
Data from the U.S. Energy Information Administration (EIA) highlights how much the U.S. generation mix has shifted in recent years.

Same Car, Cleaner Electricity
As an EV ages, its battery may lose some maximum range, but the vehicle’s energy use per mile remains about the same. What changes is the source of that energy. If you received a Model 3 when deliveries began in July 2017, here is how the U.S. grid powering it has evolved since then, based on EIA net generation:
| Source | 2017 Share | 2025 Share |
|---|---|---|
| Natural gas | 32.2% | 40.9% |
| Coal | 29.9% | 16.6% |
| Nuclear | 19.9% | 17.7% |
| Wind | 6.3% | 10.4% |
| Hydroelectric | 7.4% | 5.5% |
| Utility-scale solar | 1.3% | 6.8% |
With full‑year figures for 2026 still pending, 2025 provides the best current comparison. Renewable sources (wind, solar, hydro, geothermal, and biomass) supplied about 17% of utility‑scale U.S. generation in 2017 and about 24% in 2025. Including nuclear, close to 42% of the grid now comes from sources that don’t burn fuel, up from 37% in 2017.


This transition has occurred while total demand grew. Utility‑scale generation rose from about 4.04 billion megawatt‑hours in 2017 to 4.43 billion in 2025, and demand is expected to keep climbing with the growth of AI data centers.
Coal Is Falling Fast
The biggest shift is coal. U.S. coal generation fell about 39% between 2017 and 2025, from roughly 1.21 billion to 735 million megawatt‑hours. Coal now produces only about 40% of what it did in 2002, when it still generated more than half of the country’s electricity.
Natural gas overtook coal as the top U.S. generation source around the middle of the last decade and has continued to grow. Nuclear output has been nearly flat since the early 2000s, yet it now produces more electricity each year than coal due to coal’s decline; nuclear briefly surpassed coal in 2019 and has remained ahead since 2022.


Renewables are gaining ground as well. Wind generation grew about 81% from 2017 to 2025, and EIA monthly data shows wind has already exceeded coal in some months, including spring 2024 and early 2026. Utility‑scale solar grew more than fivefold over the same period, and including rooftop systems, total U.S. solar generation rose from about 77 million megawatt‑hours in 2017 to more than 393 million in 2025.

Cheaper to Run, Cleaner Every Year
EVs are not entirely zero‑emission when electricity production and battery manufacturing are considered. Even so, EVs come out ahead of gas cars over their lifetimes on the current grid mix because electric motors convert far more of their energy into motion than combustion engines do—and unlike a gas car, an EV’s emissions per mile drop as the grid decarbonizes.
Cost trends support the transition as well. Early EVs carried higher upfront prices, but scaling by Tesla and Chinese manufacturers has brought prices much closer to gasoline vehicles. Cheaper charging and lower maintenance improve total cost of ownership, and using domestic electricity instead of gasoline also reduces reliance on imported oil. Policy discussions continue, including a new House bill proposing to bring back the federal EV tax credit, but the efficiency advantage does not depend on incentives.
If coal keeps declining while wind and solar continue to expand at their recent pace, the Tesla in your driveway will get cleaner every year you own it.















Share:
Tesla 2026 Shareholder Meeting: Three Proposals, Vote by December 2
USPTO Grants US-D1156251-S, Protecting Model S Design Until 2041