
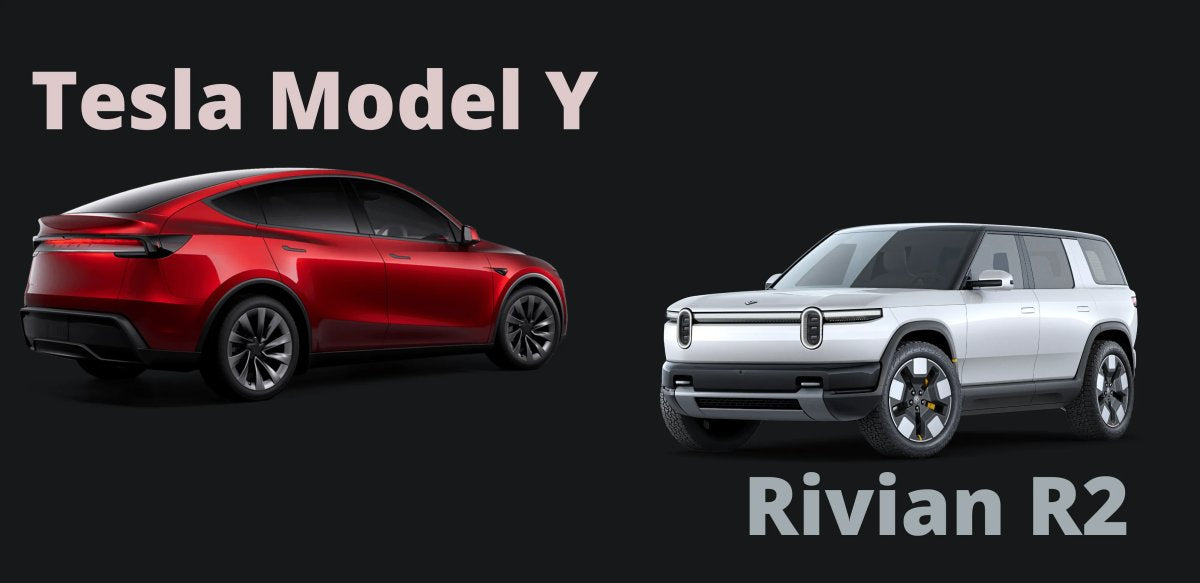

Official window-sticker metrics show the Rivian R2 Performance tying Tesla’s Model Y Performance on combined EPA efficiency at 105 MPGe and 32 kWh per 100 miles. Rivian CEO RJ Scaringe has said the R2 matches the Model Y in energy consumption.
Laboratory EPA cycles, however, don’t always mirror everyday driving. A real-world comparison reported by Electrek and conducted by Out of Spec Reviews pitted both performance SUVs on the same routes. In those side-by-side runs, the R2 used between 18% and 26% more energy at every tested speed.
As Rivian R2 customer deliveries officially began last month, these on-road findings underscore the difference between EPA procedures and day-to-day driving.

Comparing On-Paper Specifications
The R2 is Rivian’s first mass-market entry, directly targeting the Model Y (see a full comparison of the Model Y and R2). It rides on a heavier chassis and has a boxier, utility-oriented profile than Tesla’s more aerodynamic crossover. The R2 Performance acts as Rivian’s flagship trim, positioned against Tesla’s Model Y Performance, with R2 Premium and R2 Standard to follow for lower price points.
| Feature | Rivian R2 Performance | 2026 Tesla Model Y Performance |
|---|---|---|
| Starting Price | $57,990 | $57,990 |
| Drivetrain | Dual-Motor AWD | Dual-Motor AWD |
| Range (EPA-est.) | 330 miles | 306 miles |
| Horsepower | 656 hp | 510 hp |
| Torque | 609 lb-ft | 513 lb-ft (estimated) |
| 0–60 mph | 3.6 sec | 3.3 sec |
| Ground Clearance | 9.6 in | 6.0 in |
| Payload | 1,168 lb | 1,124 lb |
| Towing Capacity | 4,400 lb | 3,500 lb |
| Battery Size | 87.9 kWh | 81 kWh |
Real-World Efficiency Head-to-Head
Test prep aimed to minimize variables: tires at 42 PSI cold, climate at 68°F on auto, two occupants per vehicle, dimmed screens, and no phone charging. The R2 ran in Conserve mode while the Model Y ran in Chill mode. Lead positions were swapped on out-and-back highway loops to avoid drafting advantages.
| Speed / Test Scenario | Rivian R2 Efficiency | R2 Energy Consumption vs. Model Y |
|---|---|---|
| 50 mph | 4.00 mi/kWh | 18.4% more energy used |
| 60 mph | 3.15 mi/kWh | 26.0% more energy used |
| 70 mph (I-95 Traffic) | 3.06 mi/kWh | 20.0% more energy used |
| 80 mph | 2.46 mi/kWh | 26.5% more energy used |
| City Simulation (20 min) | 1.9 kWh consumed | 18.8% more energy used |
Even in the city-focused scenario meant to leverage Rivian’s front-motor mechanical decoupling, the Model Y used 1.6 kWh over 20 minutes compared to 1.9 kWh for the R2. Watch Out of Spec Reviews’ full efficiency test below:
Charging Speeds and Highway Cruising
Charging is where the R2 Performance claws back time. In a 15-minute 10% charge test, it held 600 amps to a 32% state of charge, peaked around 229 kW, and added 48.3 kWh.
Out of Spec Reviews also ran its “10% Challenge,” charging each vehicle from 10% for exactly 15 minutes and then cruising at 80 mph until returning to 10%. The R2 Performance achieved 2.2 mi/kWh at 80 mph and covered 92.8 miles before reaching 10% again.
By comparison, the Model Y Performance went 103 miles at 3.3 mi/kWh on less total added energy. While the R2 pulls higher power at the plug, Tesla’s sleeker shape and lower mass preserve an edge in highway efficiency. See the “10% Challenge” here:





Share:
Release Notes 2026.20.10
Tesla FSD Safety Stats From Europe: 5.2x Safer Than Humans